


Tron (TRXUSD) has been trading within a symmetric triangle pattern on its daily time frame, suggesting that the cryptocurrency is in a period of consolidation before a potential significant move in either direction.
Price action has been compressing between descending resistance and ascending support trendlines, with the current price hovering around $0.2273.
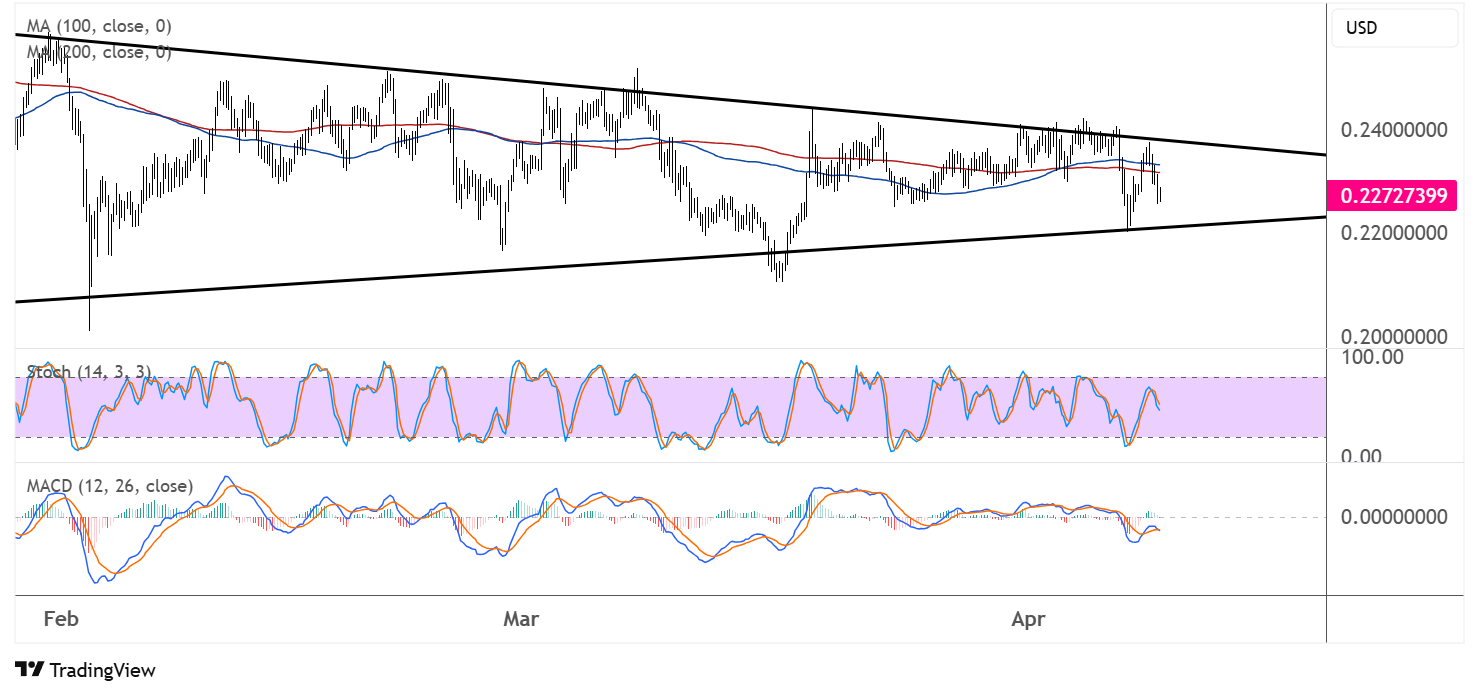
The symmetric triangle formation that began in February 2025 has been containing Tron price action for several weeks. This pattern typically represents a period where buying and selling pressures reach equilibrium before a breakout occurs. The upper resistance trendline connects the lower highs since early February, while the lower support trendline connects the higher lows formed over the same period.
Key Tron Levels to Watch
Support levels to watch include:
- The lower trendline of the symmetric triangle at approximately $0.2200
- Previous structural support at $0.2150
- The February low near $0.2000
Resistance levels include:
- The upper trendline of the symmetric triangle around $0.2320
- Previous swing high at $0.2400
- The psychological level at $0.2500

Tron Technical Analysis
Price is currently testing the 100-period moving average, which is positioned just above the 200-period moving average. This positioning of moving averages suggests that the medium-term momentum remains cautiously bullish, though the narrowing gap between these indicators could signal weakening upward momentum.
The Stochastic oscillator is showing significant oscillations within the overbought and oversold territories, indicating the ranging nature of the market. Currently, the Stochastic appears to be moving upward from a recent dip, suggesting short-term buying pressure may be building. However, it’s approaching the overbought region, which could signal potential exhaustion of the current minor bullish move.
The MACD indicator is hovering near the zero line with shallow histogram bars, reflecting the market’s indecision. The MACD line and signal line are intertwined, further confirming the consolidation phase. A clear divergence between these lines would provide a stronger directional signal for future price movement.
Tron Price Outlook
If TRX/USD breaks above the upper trendline of the symmetric triangle with convincing volume, it could target the $0.2400 level initially, with further potential to test the $0.2500 psychological resistance. This scenario would be reinforced if the MACD shows a bullish crossover and the Stochastic maintains its upward trajectory.
Conversely, a breakdown below the lower trendline could accelerate selling pressure, potentially driving the price toward the $0.2000 support level. This bearish scenario would be validated if the MACD forms a bearish crossover and the Stochastic turns lower from overbought conditions.
Tron price action appears to be influenced by broader cryptocurrency market sentiment, which has been cautious amid fluctuating regulatory developments. The network’s ongoing technological improvements and expanding DeFi ecosystem continue to provide fundamental support, though recent market uncertainty has kept price movements contained within the triangle formation, allowing Tron to exhibit relative resilience compared to bitcoin and ethereum which are breaking below key support levels.
Trading volume has been declining throughout the formation of this pattern, which is typical for symmetric triangles and often precedes a significant move. As the apex of the triangle approaches (where the two trendlines meet), the probability of a breakout increases.
Traders may consider waiting for a decisive breakout from the symmetric triangle before establishing new positions. A break above the upper trendline with increased volume could confirm a bullish continuation, while a break below the lower trendline might signal a deeper correction or potential trend reversal.

