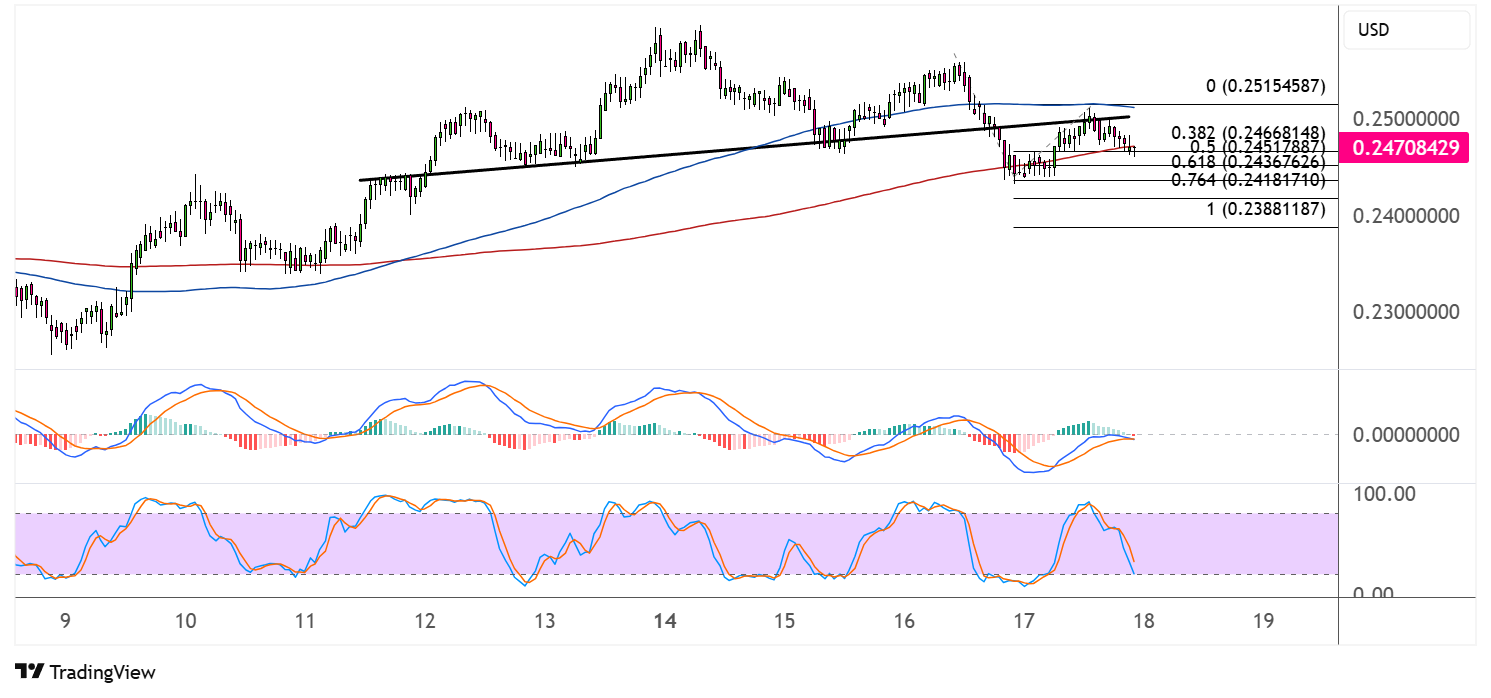


Tron (TRXUSD) has been trading within a defined range after a recent pullback from its highs around $0.25 level. The pair appears to be consolidating between key Fibonacci retracement levels, suggesting a potential setup for the next directional move.
Price recently formed a head and shoulders bearish reversal pattern and has since broken below the neckline support to confirm a downtrend. TRXUSD is in the middle of retesting this broken support zone that could now hold as resistance.
Key Tron Levels to Watch
The chart shows several important Fibonacci retracement levels that are currently influencing price action. The 0.382 Fib level at $0.2466 has acted as resistance, while the pair is now hovering around the 0.5 Fibonacci level at $0.2451. Below this, the 0.618 Fib at $0.2436 provides the next support, followed by the 0.764 level at $0.2418.
A clear ascending trendline that has supported price action since early April is visible on the chart, suggesting an underlying bullish bias despite recent consolidation. The current price ($0.2470) sits at a critical juncture between the 0.382 and 0.5 Fibonacci levels.
If sellers manage to push the price below the 0.618 Fib level at $0.2436, we could see an extended move down to test the 1.0 Fibonacci level at $0.2388, which would represent a complete retracement of the previous upward movement.
On the upside, a break above the 0 Fib level at $0.2515 could signal a continuation of the broader uptrend and potentially target new local highs.

TRXUSD Technical Analysis
The moving averages on the chart present a cautiously bullish picture. The blue 100 SMA is positioned above the red 200 SMA, forming a golden cross pattern that typically signals bullish momentum in the medium term. Currently, price is testing the blue moving average, which might act as dynamic support.
The stochastic oscillator, visible in the lower panel, has recently turned upward after approaching oversold territory. This suggests diminishing bearish momentum and a potential shift in favor of buyers in the near term. However, it has not yet reached the overbought zone, indicating there’s still room for upward movement before resistance becomes significant from this indicator’s perspective.
The MACD indicator (represented by the blue and orange lines in the middle panel) shows convergence after a bearish period, with histogram bars (green and red vertical bars) shrinking in size. This signals weakening bearish momentum and a possible trend reversal if the blue line crosses above the orange signal line in the coming sessions.
Tron Price Outlook
Tron appears to be at a decision point, with technical evidence suggesting a bullish bias but with notable resistance overhead. The current consolidation between the 0.382 and 0.618 Fibonacci levels indicates market indecision following the previous uptrend.
The presence of the ascending trendline and the golden cross of moving averages supports a bullish outlook, suggesting that the current pullback might be a temporary correction within a larger uptrend. The turning stochastic oscillator adds weight to this interpretation.
In the near term, traders should watch for a definitive break either above the 0.382 Fib level at $0.2466, which could trigger a move toward the $0.25 psychological level and potentially the 0 Fib at $0.2515, or below the 0.618 Fib at $0.2436, which might accelerate selling pressure toward the $0.24 zone.
The current market structure suggests that bulls still have a slight edge, but they need to defend the 0.5 Fibonacci level at $0.2451 to maintain control. With the technical indicators showing early signs of bullish momentum building, a bounce from current levels would not be surprising in the days ahead.
However, traders should remain cautious of broader market sentiment affecting cryptocurrencies, as external factors could potentially override these technical signals.

