


Solana is currently trading at $125.57, showing signs of consolidation after a strong recovery from the early April lows. The cryptocurrency remains within a broader descending channel while testing a significant support zone highlighted by the blue horizontal band on the chart.
Recent price action suggests a battle between bulls attempting to maintain the recovery momentum and bears looking to reassert the dominant downtrend.
Key Solana Levels to Watch
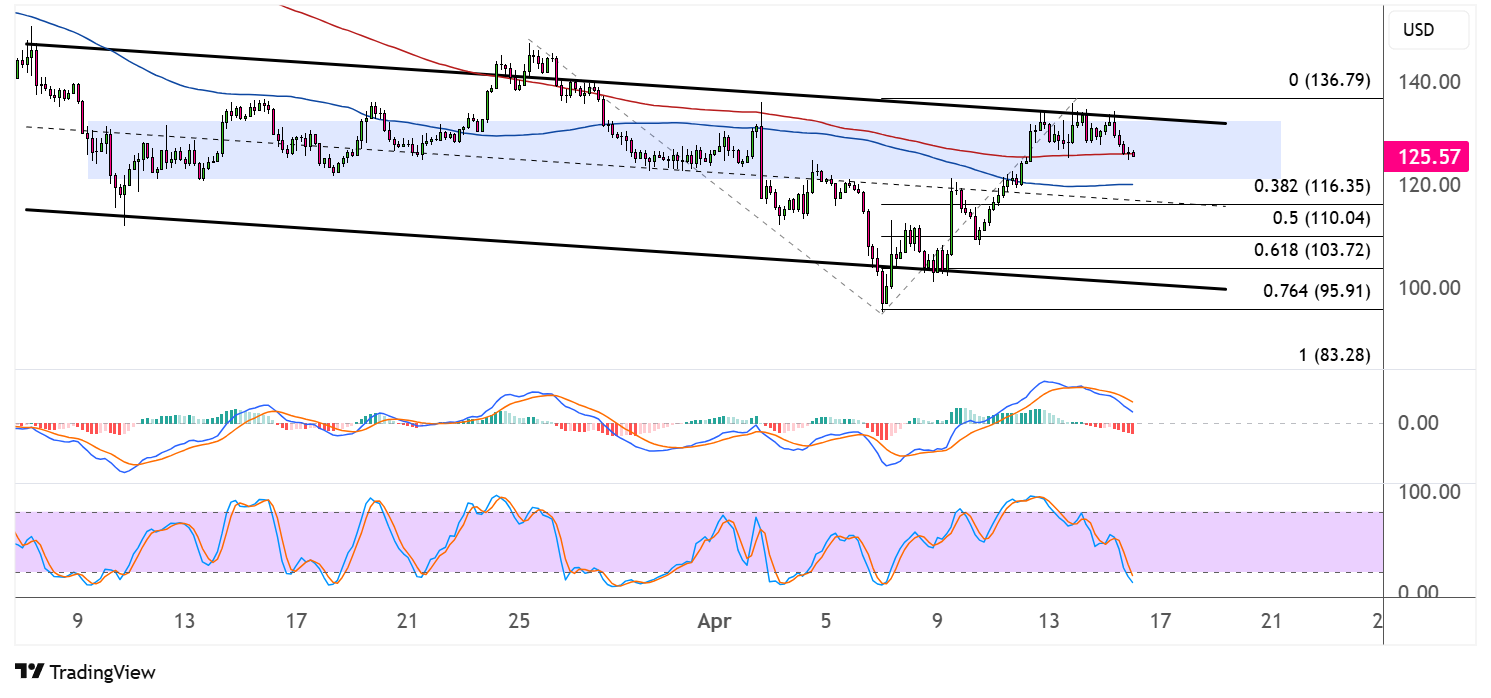
The descending channel boundaries serve as the primary structural elements on the chart. The upper resistance trendline that begins from the highs near $142.00 has consistently capped upside attempts and currently sits around $133.00-$135.00, aligning closely with the swing high $136.79.
On the downside, the lower support trendline of the channel provides a floor near $95.00-$100.00, which coincides with the 0.764 Fibonacci extension level at $95.91. This channel has contained price action since early March, making these boundaries critical for determining Solana’s next directional move.
The blue horizontal band on the chart represents a significant zone of price congestion and historical support/resistance, currently operating as support in the $123.00-$127.00 region. This zone has repeatedly proved significant throughout March and appears to be containing the current pullback.
Fibonacci extension levels provide additional bearish targets should the downtrend gain traction. The current price at $125.57 is holding above the 0.382 Fibonacci extension at $116.35, which represents the next major support should the current level fail.
The 200-period moving average (red line) is flattening after a downward slope and currently sits slightly above price, acting as dynamic resistance around the $128.00 level, while the 100-period moving average (blue line) has started to curl upward near the $121.00 level, providing potential support.

Solana Technical Analysis
The price is currently navigating between its 100-period and 200-period moving averages, creating a compression zone that often precedes a significant directional move. The 200-period moving average has started to flatten and turn slightly upward, which is a moderately positive sign for the medium-term outlook.
The MACD indicator (middle panel) shows deteriorating momentum with the histogram bars diminishing in height and turning slightly negative. The blue line has crossed below the orange signal line, suggesting renewed downside pressure in the near term.
The Stochastic oscillator (bottom panel) has decisively crossed downward and is heading toward oversold territory, indicating increasing bearish momentum. This suggests that sellers may be regaining control after the recent pullback from resistance levels.
Volume analysis indicates diminishing trading activity during the recent consolidation phase, with a slight dominance of red (selling) bars over green (buying) ones in recent sessions. The pattern of decreasing volume during consolidation often precedes another significant move, but the direction remains uncertain.
Solana Price Outlook
Solana appears to be in decision mode, as it tests important technical support levels while trapped within the descending channel formation. The recovery from early April lows has been impressive, but the rejection at the upper channel boundary and subsequent pullback suggest the broader downtrend remains intact.
In the short term, Solana needs to defend the blue horizontal support zone and stay above the 0.382 Fibonacci retracement level at $116.35 to maintain bullish hopes. The 200-period moving average beginning to curl upward provides a tentative positive signal that could support a bounce from current levels.
For any meaningful bullish reversal, Solana would need to overcome the 100-period moving average around $128.00, followed by the descending trendline resistance near $133.00, and finally the 0 Fibonacci level at $136.79. This triple resistance zone makes a bullish breakout challenging in the near term.
Conversely, a decisive break below the blue support zone and the 0.382 Fibonacci level could trigger an accelerated decline toward the 0.5 Fibonacci retracement at $110.04, followed by the 0.618 level at $103.72.

