


Solana has recently shown significant bearish momentum on its 4-hour chart, following a rejection at key Fibonacci retracement levels. After establishing recent highs above $136, price action has formed a series of lower highs and lower lows, confirming the short-term downtrend that’s currently in play.
The recent price action shows SOL/USD dropping below several important support zones, most notably breaking below the psychological $120 level. Currently trading around $115.30, Solana appears to have found temporary support after the recent decline, though bearish pressure remains evident.
Key Solana Levels to Watch
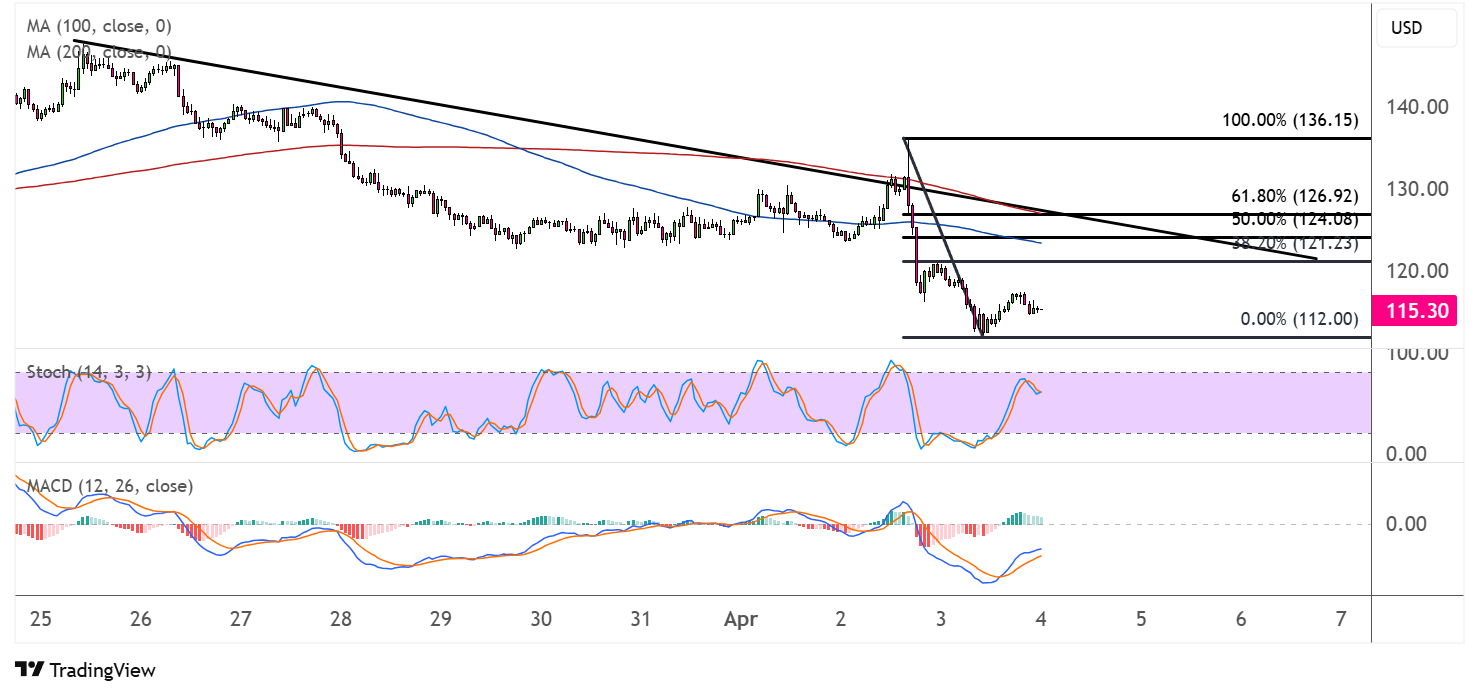
The Fibonacci retracement tool applied to the recent swing high and low reveals critical resistance levels that sellers have successfully defended. The 61.8% Fibonacci level at $126.92 acted as strong resistance during the recent pullback attempt. Similarly, the 50% retracement level at $124.08 and the 38.2% level at $121.23 have both served as rejection points, further confirming the bearish bias.
The current price at $115.30 is holding near the 0% Fibonacci level (around $112.00), which represents a critical support zone. How price reacts at this level could determine whether we see a bounce or continued decline in the coming sessions.
The price action has carved out what appears to be a bearish flag pattern following the sharp decline from the $136 level. This continuation pattern, if validated by further downside, suggests potential for additional losses.
Key resistance levels to watch:
- $121.23 (38.2% Fibonacci)
- $124.08 (50% Fibonacci)
- $126.92 (61.8% Fibonacci)
- $136.15 (100% Fibonacci/Previous high)
Critical support levels:
- $112.00 (Recent low/0% Fibonacci)
- $100.00 (Psychological round number)

SOLUSD Technical Analysis
Looking at the moving averages, both the 100 SMA and 200 SMA are positioned above the current price, with the 100 SMA (blue line) now crossing below the 200 SMA (red line). This bearish crossover typically signals increased selling pressure and confirms the downtrend’s strength. The dynamic resistance provided by these moving averages adds another layer of confirmation to the bearish outlook.
The stochastic oscillator is showing some bullish divergence as it begins to turn upward from oversold territory. However, with the oscillator still below the midpoint of its range, sellers maintain overall control. If the stochastic continues its upward trajectory, we could see a short-term relief rally back toward the Fibonacci resistance levels.
The MACD indicator at the bottom of the chart is showing negative momentum with the MACD line below the signal line, though the histogram bars are beginning to shrink, suggesting the bearish momentum may be losing steam.
Solana Price Outlook
The path of least resistance appears to be downward for SOL/USD in the near term. Any retracement to the identified Fibonacci levels should be watched for potential selling opportunities. Reversal candlestick patterns at these resistance zones could offer entry points for bearish positions.
For bulls to regain control, SOL/USD would need to close decisively above the 61.8% Fibonacci level at $126.92 and reclaim the territory above the moving averages. Until then, the technical outlook favors sellers.
Traders should also be mindful of the broader cryptocurrency market sentiment, especially Bitcoin’s price action, which often influences altcoin movements. The appearance of reversal candlestick patterns, particularly at support or resistance zones, could provide early signals of potential trend changes.
As with Bitcoin, longer-term investors should monitor whether Solana can hold above its trend line on higher timeframes to determine if this is merely a correction within a larger bullish cycle or the beginning of a more significant reversal.

