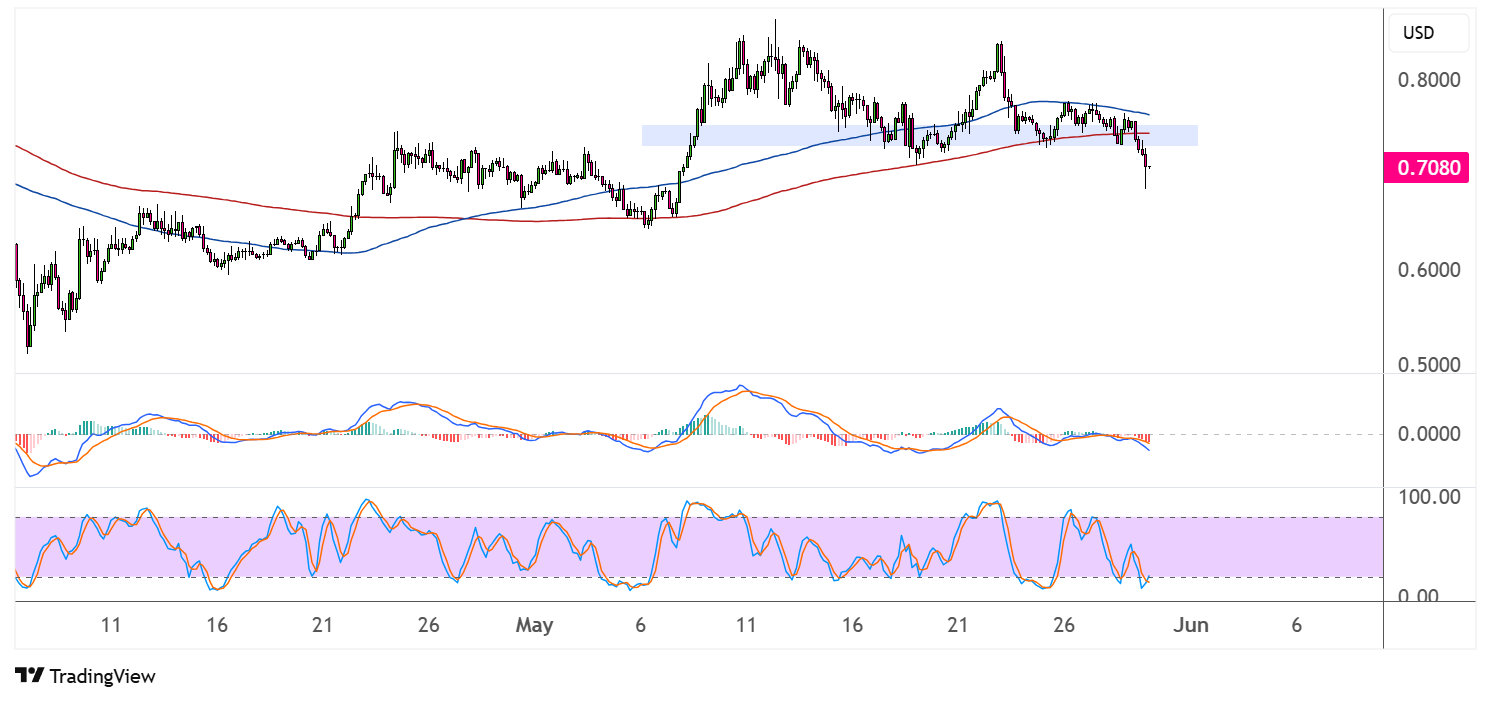


Cardano has experienced a significant breakdown from its established trading range, with ADA/USD currently trading around $0.7080 after breaking below a critical support zone that had been highlighted in blue on the chart.
The cryptocurrency appears to have completed a double-top formation earlier in the month, with peaks around $0.8200, before succumbing to selling pressure that has now pushed price below the key $0.7400-$0.7500 support area. This technical development suggests that Cardano may be entering a more prolonged corrective phase after months of consolidation.
The breakdown from the $0.7400 neckline support zone represents a significant shift in market structure for ADA/USD. This area had previously acted as reliable support during multiple tests throughout April and May, making the recent break particularly noteworthy from a technical perspective.
The failure of this support level indicates that the balance between buyers and sellers has shifted decisively in favor of the bears, potentially opening the door for further downside movement.

Bearish Technical Indicators
Moving averages are now working against Cardano’s bulls, with the shorter-term averages having crossed below longer-term ones during the recent decline. The red 200 SMA appears to be providing dynamic resistance above current price levels, while the blue 100 SMA is also acting as a ceiling for any potential bounce attempts.
The stochastic oscillator has been oscillating between overbought and oversold extremes throughout the recent trading period, but the current reading suggests that selling pressure remains intact. While the oscillator has touched oversold levels multiple times, it has failed to generate any sustained recovery, indicating that bears maintain control of the near-term price action.
The MACD indicator is displaying clear bearish signals, with the histogram showing consistently negative readings throughout the recent decline. The MACD line appears to have crossed below its signal line, confirming the current downward momentum. This bearish crossover, combined with the expanding negative histogram, suggests that the selling pressure is not only persistent but potentially accelerating.
Key Support And Resistance Levels
With the breakdown from the $0.7400-$0.7500 support zone now complete, Cardano faces the next significant support test around the $0.6800-$0.7000 area. This psychological level near $0.70 could provide some temporary relief for bulls, but a sustained break below this zone could open the door for a test of the $0.6500 level or lower.
On the upside, ADA/USD would need to reclaim the broken support zone around $0.7400-$0.7500 to signal that the recent weakness was merely a false breakdown. However, given the current alignment of technical indicators and moving averages, any recovery attempts are likely to face significant resistance.
Volume patterns during the breakdown have been noteworthy, with increased selling volume evident during key support failures. This suggests that the current move lower has conviction behind it, rather than being driven by thin trading conditions. The combination of the technical Cardano breakdown and volume confirmation typically indicates that further downside movement may be in store.

