


Binance Coin (BNBUSD) is currently trading at $588.70, showing signs of stabilization after forming a potential double bottom pattern earlier this month.
The cryptocurrency appears to be consolidating within a defined range as it attempts to establish a foothold above the moving averages.
Key BNBUSD Levels to Watch
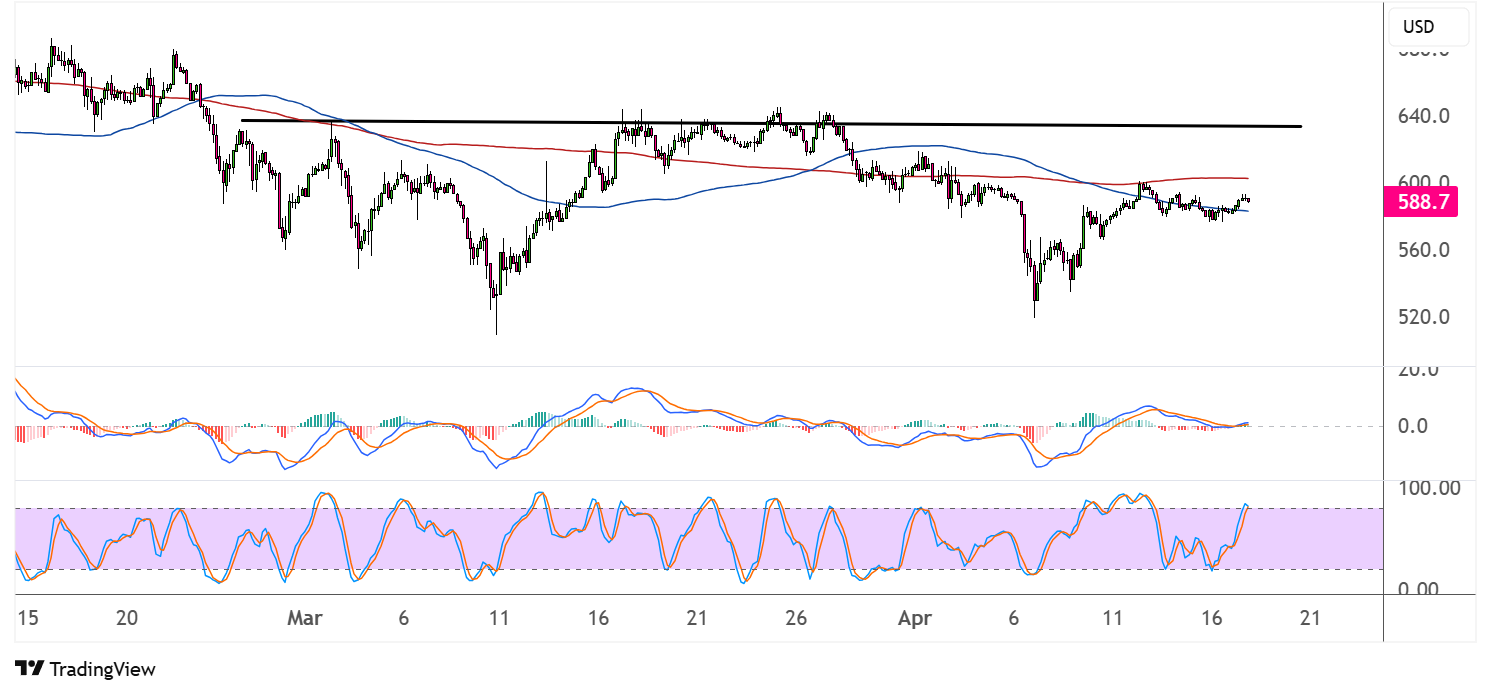
BNBUSD has established a clear horizontal resistance at approximately $640, which has capped price action multiple times since mid-March. This level represents a significant barrier that bulls must overcome to resume the upward trend. The price has tested this resistance on at least four occasions, turning it into a well-defined ceiling.
On the downside, the recent double bottom pattern formed with lows around $520-$530 serves as a crucial support zone. This pattern typically signals a potential reversal and has so far prevented further declines. A break below this support could accelerate selling pressure toward the $500 psychological level.
The current trading range between $580-$600 represents an immediate decision zone, with the 200-day moving average (red line) at approximately $605 serving as near-term resistance. The 50-day moving average (blue line) has been declining and currently sits around $595, creating a zone of confluence resistance with the 200-day MA.
If buyers manage to push prices above both moving averages decisively, the next target would be the horizontal resistance at $640. Conversely, a break below the immediate support at $580 could retest the $560 level, which previously acted as a stepping stone during the recovery from April’s lows.

BNBUSD Technical Analysis
The moving averages present a bearish bias in the medium term, with the 100-day MA (blue line) below the 200-day MA (red line), indicating a death cross formation that occurred in late March. However, the price is currently challenging both moving averages, which could signal a potential shift in momentum if successfully broken to the upside.
The stochastic oscillator in the lower panel shows an interesting development, with readings recently reaching the overbought territory above 80 before pulling back. The oscillator is now turning upward again from around the midpoint level, suggesting a potential buildup of bullish momentum while avoiding extreme readings that might signal exhaustion.
The MACD indicator (represented by the blue and orange lines in the middle panel) shows convergence after a bearish period. The histogram bars are shortening, indicating diminishing downside momentum. While not yet bullish, the MACD is showing early signs of a potential shift in momentum, which would be confirmed if the blue line crosses above the orange signal line in the coming sessions.
BNBUSD Price Outlook
BNBUSD appears to be at a critical juncture following the formation of a descending triangle pattern in early April. The current technical structure suggests a cautiously neutral to slightly bullish outlook in the near term, contingent upon the cryptocurrency’s ability to overcome immediate resistance levels.
The formation of the double bottom pattern at $520-$530 is a positive development for bulls, suggesting that selling pressure may have been exhausted at those levels. The subsequent bounce and consolidation above $580 indicate potential accumulation, which could lead to further upside if volume supports the move.
For the bullish scenario to gain traction, BNBUSD needs to clear both the 100-day and 200-day moving averages decisively, followed by a break above the stubborn horizontal resistance at $640. Such a move would likely trigger a significant rally, potentially targeting the $680-$700 range.
However, caution is warranted as the longer-term technical picture remains bearish, evidenced by the death cross formation and the prevailing downtrend since February. If BNBUSD fails to overcome the moving average resistance zone around $595-$605, we could see a continuation of the range-bound trading or potentially another test of lower support levels.

