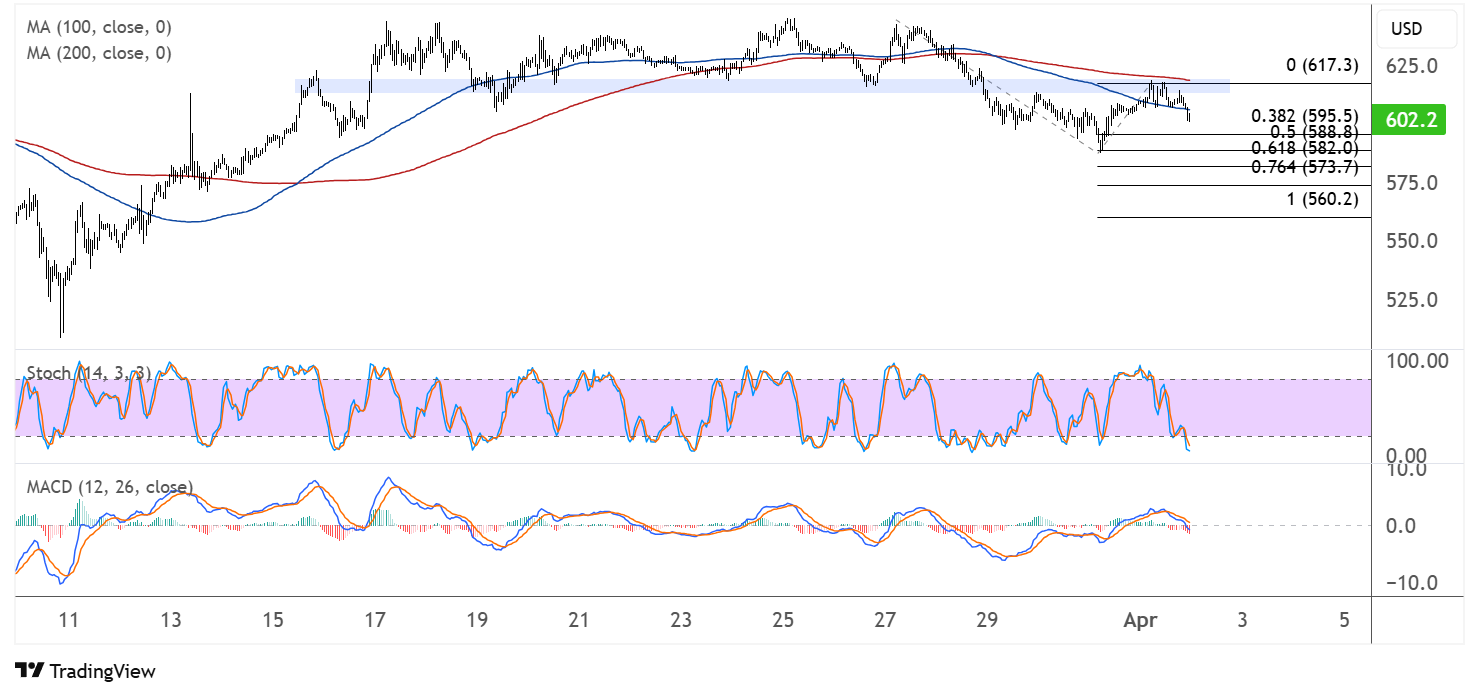


Binance Coin has been exhibiting bearish price action over the recent trading sessions, with the cryptocurrency currently trading at $602.20. Earlier on, BNBUSD staged a bearish break from a triangle consolidation pattern to tilt the odds in favor of bears.
After forming a notable high around the $617.30 level (marked as the 0 Fibonacci level), BNB has entered a corrective downtrend that appears to be gaining momentum. A move back above this area of interest could signal a pickup in bullish pressure while further losses beyond the swing low could confirm that the bearish trend is gaining traction.
Key Binance Coin Levels To Watch
The chart displays significant Fibonacci extension levels that could serve as the next potential targets. After retracing to the former support area, the price has shown some hesitation but continues to face selling pressure. Key Fibonacci levels to watch include:
- 0% level: $617.30 (recent high)
- 38.2% extension: $595.50
- 50% extension: $588.80
- 61.8% extension: $582.00
- 76.4% extension: $573.70
- 100% extension: $560.20
The price is currently testing support near the 38.2% Fibonacci level, which could serve as a temporary floor. However, the overall technical structure suggests further downside potential toward the 50% and 61.8% retracement levels.

BNBUSD Technical Analysis
The 100-period moving average (blue line) and 200-period moving average (red line) are positioned bearishly, with the 100 MA crossing below the 200 MA. This bearish crossover signals deteriorating momentum and potential for continued selling pressure. Currently, both moving averages are acting as dynamic resistance levels, with the 100 MA at approximately $610 limiting any upward attempts.
The price structure shows Binance Coin trading below both key moving averages, which is a classic bearish configuration suggesting that sellers maintain control of the market’s direction in the near term.
The Stochastic oscillator (14,3,3) is heading downward from overbought territory, suggesting that bullish momentum is fading. This downward trajectory in the Stochastic supports the bearish bias and indicates that sellers are regaining control of the market.
The MACD (12,26) indicator shows bearish momentum building as the MACD line crosses below the signal line and approaches the zero line. The histogram bars are shrinking below the centerline, confirming weakening bullish momentum and increasing bearish pressure.
Binance Coin appears to be forming a potential lower high and lower low pattern on the chart, which is characteristic of a downtrend. The previous support zone around $610-$617 has now transformed into a resistance area. The price action has been creating lower highs since late March, with each rally being met with increased selling pressure.
Binance Coin Price Outlook
The short-term outlook for Binance Coin suggests continued weakness toward the $582.00 level (61.8% Fibonacci level), which could serve as the next significant support. If this level fails to hold, further decline toward the 76.4% extension at $573.70 becomes likely.
Recall that BNBUSD has tumbled despite outperforming ETH in a key statistic called daily volume, with the token burn serving as the next main catalyst for price trends.
For potential recovery, BNB would need to reclaim and hold above the area of interest, followed by breaking above the 200 MA around $610. A daily close above the 0% Fibonacci level ($617.30) would be required to invalidate the current bearish bias and potentially signal a trend reversal.
Traders should monitor for potential reversal candlestick patterns at key Fibonacci levels, as these could indicate a shift in market sentiment. Additionally, volume analysis would be beneficial to confirm the strength behind the current downtrend and identify potential exhaustion points.

